Data Analytics Internship - 3 Month Offline Training Program
Join 3 Month Data Analytics Offline Internship Training Program at NextVision Infotech, Patna. Master Excel, SQL, Power BI, Python, statistics, machine learning basics, research with hands-on lab training. ₹1249 only with certificate.
Program Description
Skills You'll Learn
Projects You'll Work On
Complete Data Analytics Project (3 Month Offline)
Students will complete an advanced data analytics project including data cleaning, Excel analysis, SQL queries, Power BI dashboard, Python analysis, statistical analysis, machine learning basics, research report, and complete project documentation as per industry standards.
Program Modules
W1-2: Weeks 1-2: Data Analytics Fundamentals and Excel
Introduction to data analytics, types of analytics - descriptive, diagnostic, predictive, prescriptive, data analytics lifecycle, data types, data sources, data quality, data cleaning, Excel fundamentals, Excel interface, formulas and functions, lookup functions - VLOOKUP, HLOOKUP, INDEX-MATCH, XLOOKUP, logical functions, text functions, date functions, math functions, statistical functions, pivot tables, pivot charts, slicers, conditional formatting, data validation, what-if analysis, power query in Excel, power pivot in Excel, Excel dashboards, advanced Excel - macros, VBA basics.
W3-4: Weeks 3-4: SQL and Databases
Introduction to databases, relational database concepts, SQL fundamentals, SELECT statement, WHERE clause, ORDER BY, GROUP BY, HAVING, JOINs - inner join, left join, right join, full join, cross join, self join, subqueries, correlated subqueries, CTEs, window functions - ROW_NUMBER, RANK, DENSE_RANK, LAG, LEAD, aggregate functions - SUM, AVG, COUNT, MIN, MAX, string functions, date functions, case statements, unions, intersections, data manipulation - INSERT, UPDATE, DELETE, data definition - CREATE, ALTER, DROP, views, stored procedures, database design, normalization, indexing, query optimization, NoSQL basics, MongoDB basics.
W5-6: Weeks 5-6: Power BI and Data Visualization
Introduction to Power BI, Power BI Desktop, Power BI Service, connecting to data sources - Excel, CSV, SQL Server, MySQL, PostgreSQL, web, APIs, Power Query, data transformation, data cleaning, data profiling, combining queries, appending queries, merging queries, data modeling, star schema, snowflake schema, relationships, cardinality, calculated columns, calculated tables, date tables, hierarchies, DAX, DAX syntax, DAX functions - aggregate functions, iterator functions, filter functions (CALCULATE, FILTER, ALL), time intelligence functions, data visualization principles, chart selection, bar charts, column charts, line charts, pie charts, maps, KPI cards, slicers, filters, bookmarks, buttons, drill-through, drill-down, dashboard design, layout design, color theory, data storytelling.
W7-8: Weeks 7-8: Python for Data Analytics and Machine Learning Basics
Python for data analytics, Python installation, Python syntax, data types, control flow, functions, NumPy fundamentals, NumPy arrays, Pandas fundamentals, Series, DataFrame, data loading, data cleaning, data transformation, data visualization - Matplotlib, Seaborn, Plotly, data analysis with Pandas, groupby, pivot tables, time series analysis, statistics for data analytics, descriptive statistics, inferential statistics, hypothesis testing, correlation analysis, regression analysis, machine learning basics, supervised learning, unsupervised learning, linear regression, logistic regression, k-means clustering, model evaluation, scikit-learn basics, Jupyter Notebook, Google Colab.
W9-10: Weeks 9-10: Advanced Analytics and Research
Advanced analytics, predictive analytics, prescriptive analytics, time series forecasting, ARIMA, exponential smoothing, A/B testing, experimentation, data mining, text analytics, sentiment analysis, web scraping, APIs for data, data engineering basics, ETL, data warehousing, data lake, big data basics, Hadoop, Spark, research methodology, research design, literature review, data collection, data analysis, research report writing, paper writing, publication.
W11-12: Weeks 11-12: Live Projects, Research, and Certification
Live projects - sales dashboard, HR dashboard, financial dashboard, marketing dashboard, customer segmentation, predictive analytics, text analytics, research report, complete documentation, resume building, interview preparation, portfolio building, LinkedIn optimization, viva-voce examination, feedback session, certificate distribution.
Key Features
What You'll Learn
Examination Details
| Exam Name | Full Marks | Pass Marks |
|---|---|---|
| Module-wise Assessment | 100 | 40 |
| Project Evaluation | 100 | 50 |
| Research Report | 100 | 50 |
| Final Presentation | 50 | 25 |
| Viva-Voce | 50 | 25 |
Internship Details
Prerequisites
- Pursuing or completed B.Tech/B.E./BCA/MCA/B.Sc./B.Com/MBA in any discipline
- Basic knowledge of Excel
- Basic knowledge of programming
- Interest in advanced data analytics and research
Who Can Enroll ?
- B.Tech students (1st to 8th semester)
- BCA/MCA students
- B.Sc. students
- B.Com students
- MBA students
- Data analytics aspirants
- Data science aspirants
- Working professionals wanting to upskill
- Students from Patna and nearby areas seeking hands-on advanced training
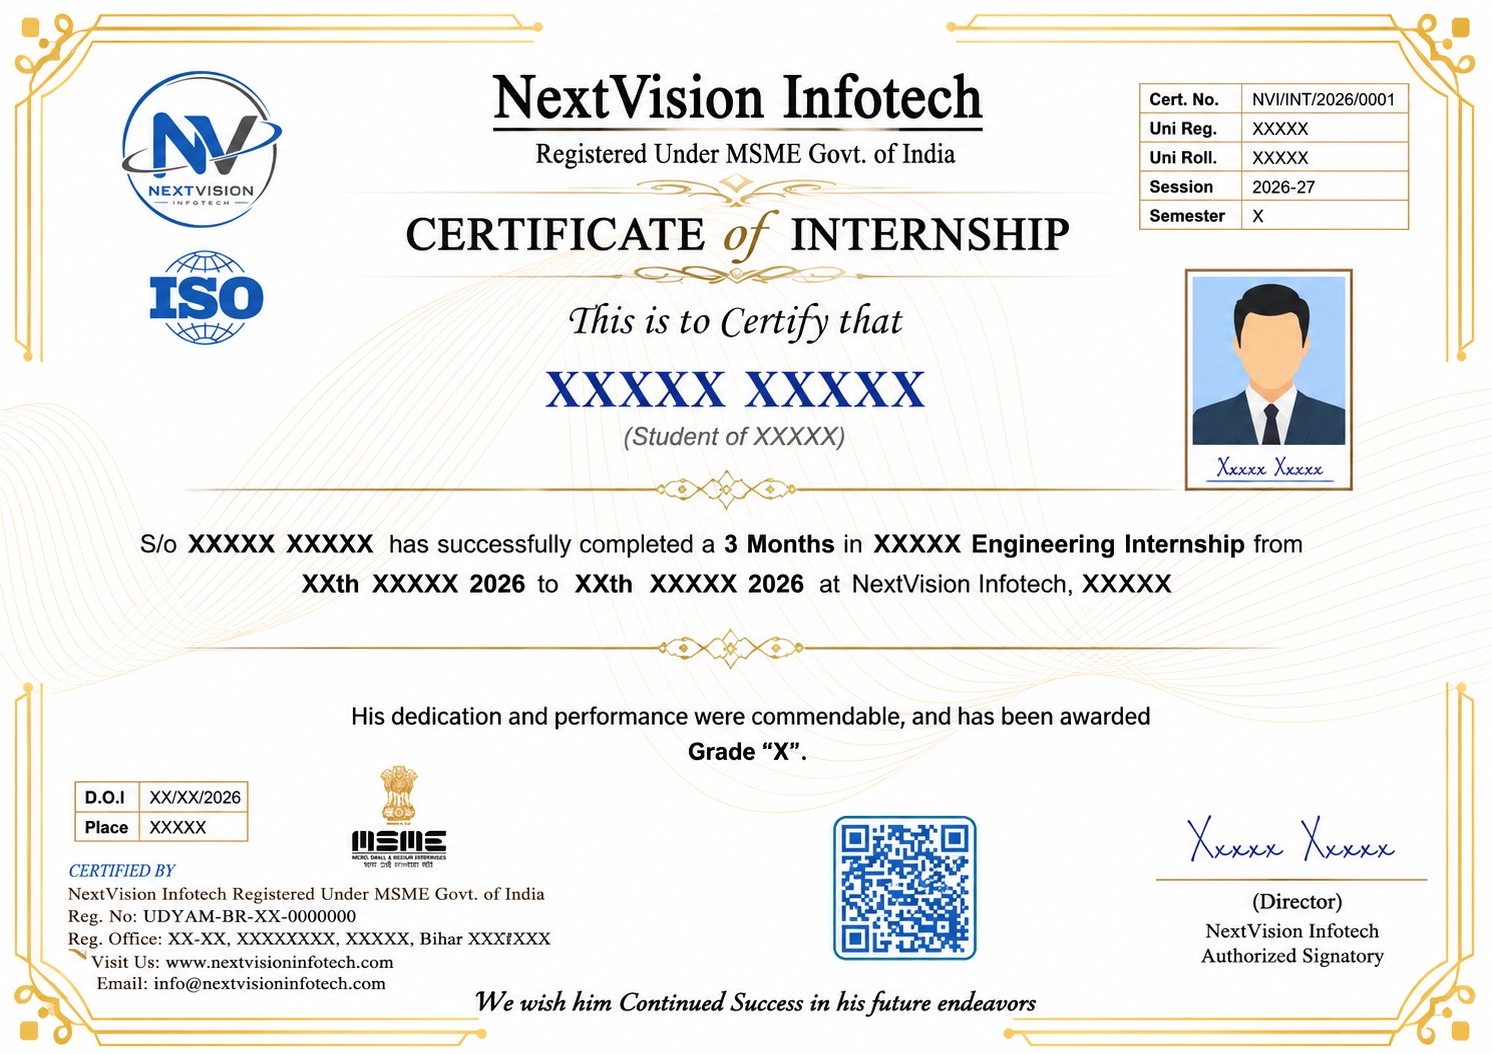
Certificate Preview
Related Internships
You might also be interested in these
Machine Learning with Python - 45 Days Internship Training Program
Join 45 Days Machine Learning with Python Internship Tr...
Generative AI - 45 Days Internship Training Program
Join 45 Days Generative AI Internship Training Program...
Data Analytics with Power BI - 45 Days Internship Training Program
Join 45 Days Data Analytics with Power BI Internship Tr...
Deep Learning - 45 Days Internship Training Program
Join 45 Days Deep Learning Internship Training Program...
Our Students Did It! 🎉 Certified & Proud
A big congratulations to our students who recently completed their courses and earned their certificates. Here's what they have to say! 🎓

Amit Kushwaha
Internship Program
"Best decision I ever made! The teaching quality and practical training helped me land my dream job. Highly recommended! 🌟"
GAURAV KUMAR PATHAK
Internship Program
"Amazing experience! The mentors are super supportive and the course content is industry-ready. Got my certificate with confidence! 💯"
Radha Chauhan
Internship Program
"NVI Gaya changed my career path completely. Practical projects, real-world skills, and expert guidance — everything was perfect! 🚀"
Mukkamula Navya sri
Internship Program
"Learned so much in such a short time. The internship gave me real experience and confidence to face interviews. Thank you NVI! 🙏"

Vipin Mehdole
Internship Program
"From zero to hero — that's how I feel after completing this course. The staff is friendly and always ready to help! ⭐"

Ajit Kumar Pal
Internship Program
"Excellent learning environment with hands-on training. I got placed right after completing my course. Forever grateful! 🎓"

MURUGESH A B
Internship Program
"The best institute in Gaya for computer courses. Practical knowledge, live projects, and job-ready skills — worth every rupee! 💎"

Mowneshwaran s
Internship Program
"Small batch sizes meant personal attention. My mentor guided me at every step. Truly a life-changing experience! ✨"

Preeti Kumari
Internship Program
"Best decision I ever made! The teaching quality and practical training helped me land my dream job. Highly recommended! 🌟"
TANNU SHREE
Internship Program
"Amazing experience! The mentors are super supportive and the course content is industry-ready. Got my certificate with confidence! 💯"

Sayan Kundu
Internship Program
"NVI Gaya changed my career path completely. Practical projects, real-world skills, and expert guidance — everything was perfect! 🚀"
Arman Kumar
Internship Program
"Learned so much in such a short time. The internship gave me real experience and confidence to face interviews. Thank you NVI! 🙏"
Samiksha Suresh Patil
Internship Program
"From zero to hero — that's how I feel after completing this course. The staff is friendly and always ready to help! ⭐"
CHANDAN KUMAR
Internship Program
"Excellent learning environment with hands-on training. I got placed right after completing my course. Forever grateful! 🎓"

Rishita chauhan
Internship Program
"The best institute in Gaya for computer courses. Practical knowledge, live projects, and job-ready skills — worth every rupee! 💎"
Our Certificate Samples
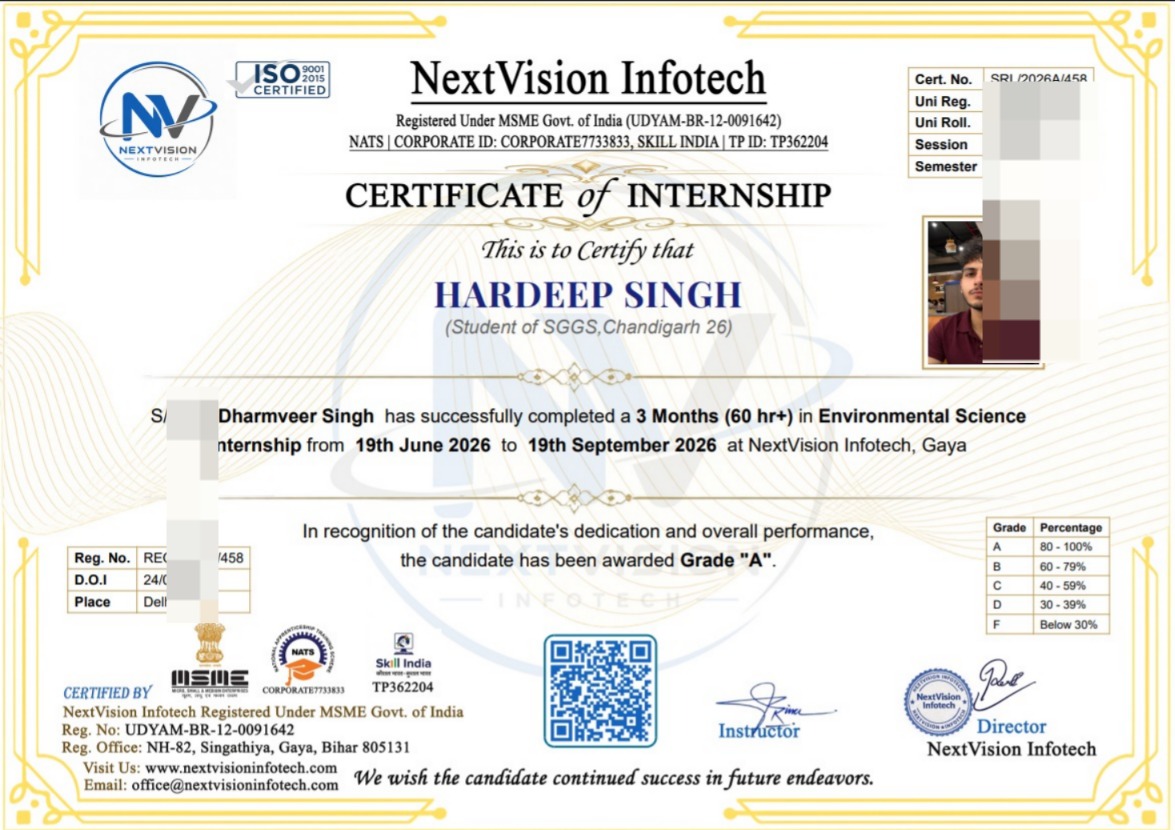
Internship Certificate
Tap to view
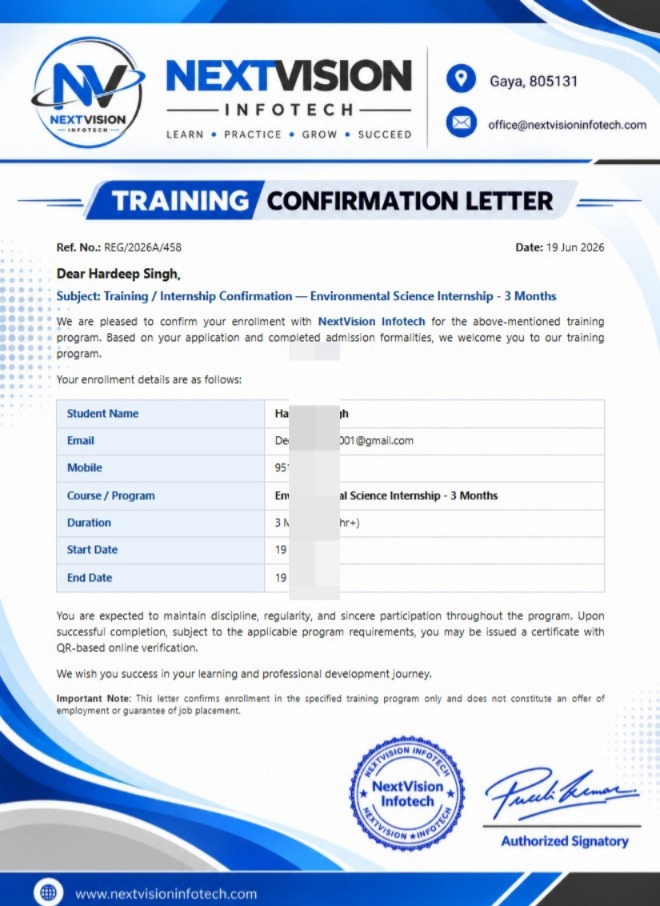
Joining Letter
Tap to view
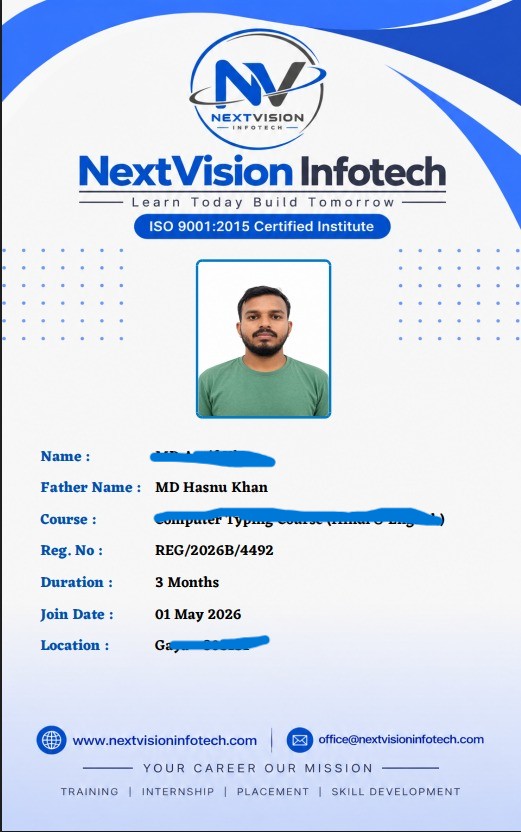
Student ID Card
Tap to view
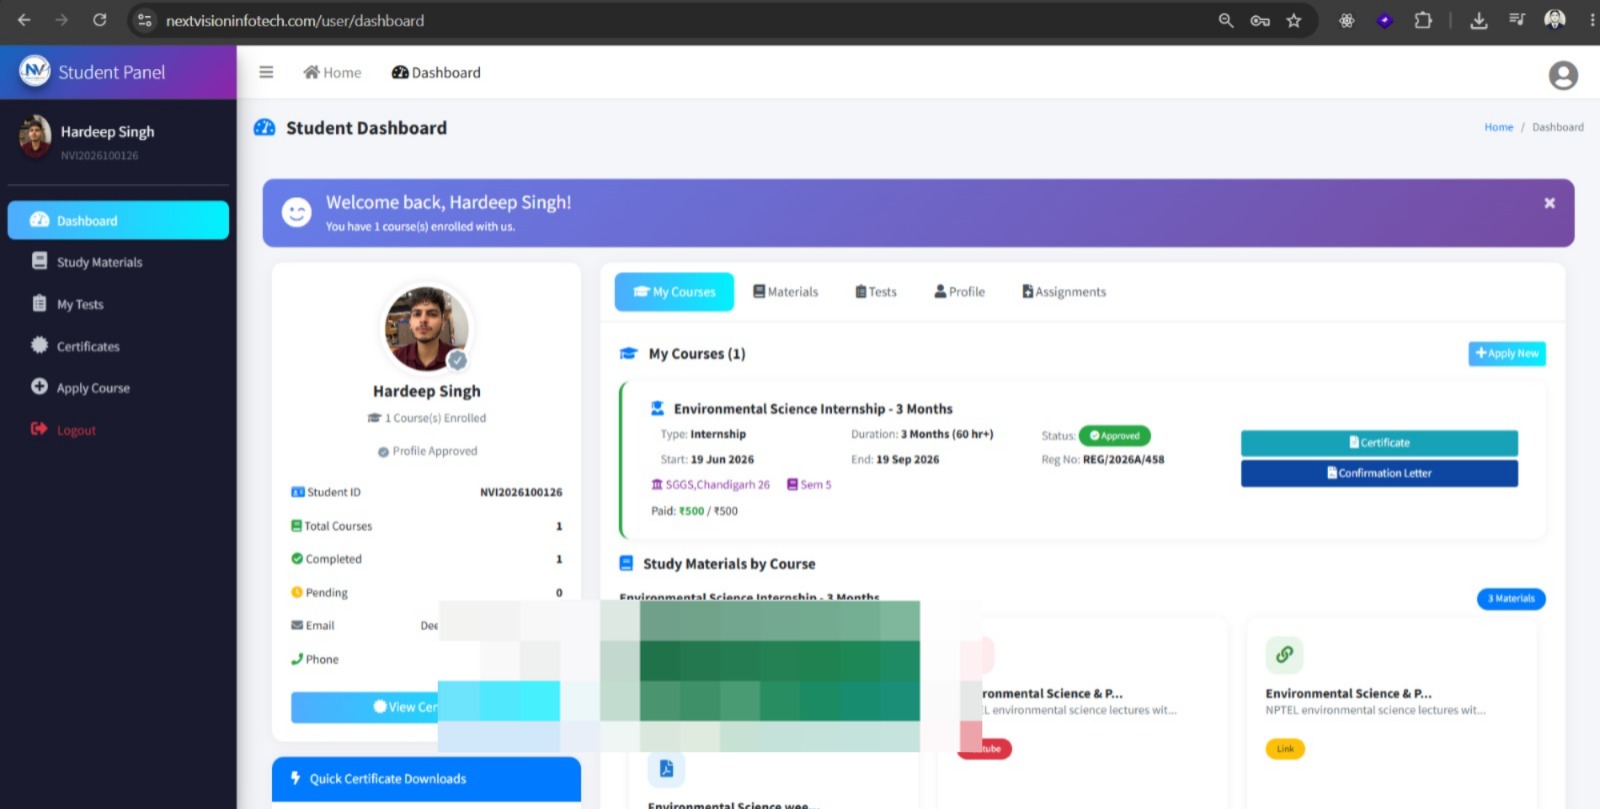
Student Panel
Tap to view
All certificates are issued by NextVision Infotech & are verifiable upon request.
Ready to Start Your Journey?
Take the first step towards your dream career with our internship programs